


For more than 20 years, ACCESS has tracked how ocean conditions are changing and how the marine ecosystem responds. Since 2004, our partners have conducted repeated ship-based surveys across the Greater Farallones and Cordell Bank National Marine Sanctuaries, sampling from coastal waters to the continental slope. Surveys are designed to capture seasonal changes across the upwelling period and long-term shifts associated with climate variability and change.
ACCESS integrates measurements across the marine food web. We monitor ocean temperature, salinity, dissolved oxygen, nutrients and ocean acidification; zooplankton, krill and forage fish; and the abundance and distribution of seabirds and marine mammals. Together, these observations allow us to connect changes in physical ocean conditions with changes in prey and top predators.
This long-term perspective is increasingly important as the California Current experiences marine heatwaves, changing upwelling, ocean acidification, deoxygenation and other climate-driven changes. ACCESS data help document how these conditions affect ecosystem productivity, prey availability, seabirds and whales, while providing information that supports sanctuary science and management.
ACCESS science has shown how changes in upwelling can propagate through the food web, how ocean acidification is affecting shelf waters, and where persistent prey and predator hotspots occur. These findings help us understand not only whether the ecosystem is changing, but how and why.
Ocean Climate Indicators
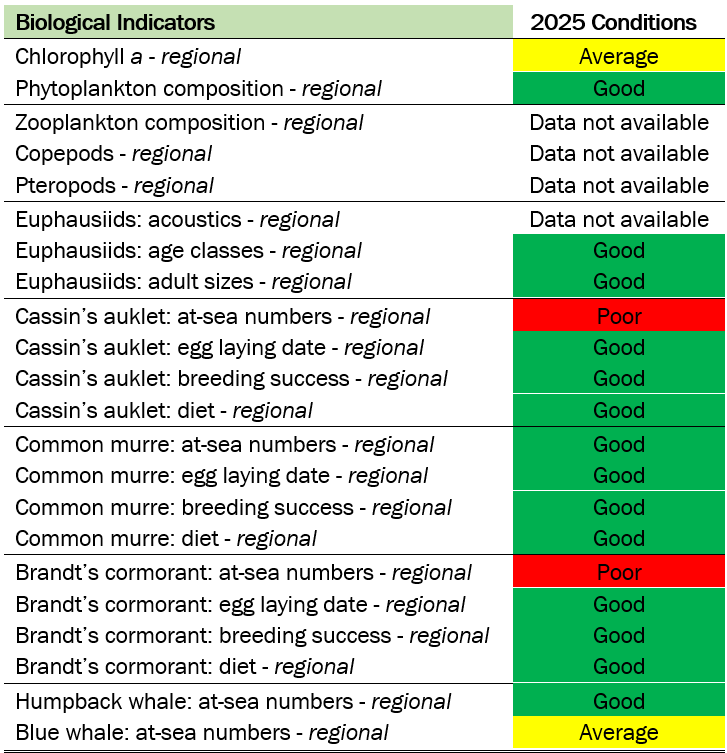
Each year, ACCESS contributes to an Ocean Climate Indicators Status Report, which brings together long-term physical and biological indicators to describe current conditions and emerging trends in the north-central California Current. The indicators were developed through a regional process involving more than 50 scientists and resource managers.
Ocean Climate Indicators Status Report: 2025
Download the Ocean Climate Indicators Status Report for 2025 or explore the summary of key indicators below.